sql physical reads in Oracle11gR2 is much higher (493.2 vs 5.65), they base same software, hardware configration, same data volume size and loading(only database 10gR2 and 11gR2 different).
TOP PHYSICAL READ SQLs the SQL is captured in Oracle11gR2 has consumed relative high physical read, why?
2010_09_23_1330_1430_pdhptlt10g.lst (Oracle10gR2) Physical reads/s: 5.65
vs
2010_1025_awrrpt_1_825_831.html (Oracle11gR2) Physical reads/s: 493.2
AWR Single SQL Statement Report(@?/rdbms/admin/awrsqrpt.sql)
75m3v4q3qa6at_awrsqlrpt_1_825_831.html
Execution Plan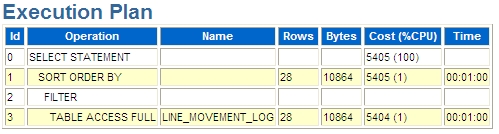
http://testwo.com/attachment/201010/29/7639_1288333490eb5G.jpg
AWR Global Report(@?/rdbms/admin/awrgrpt.sql)
SQL ordered by Reads (Global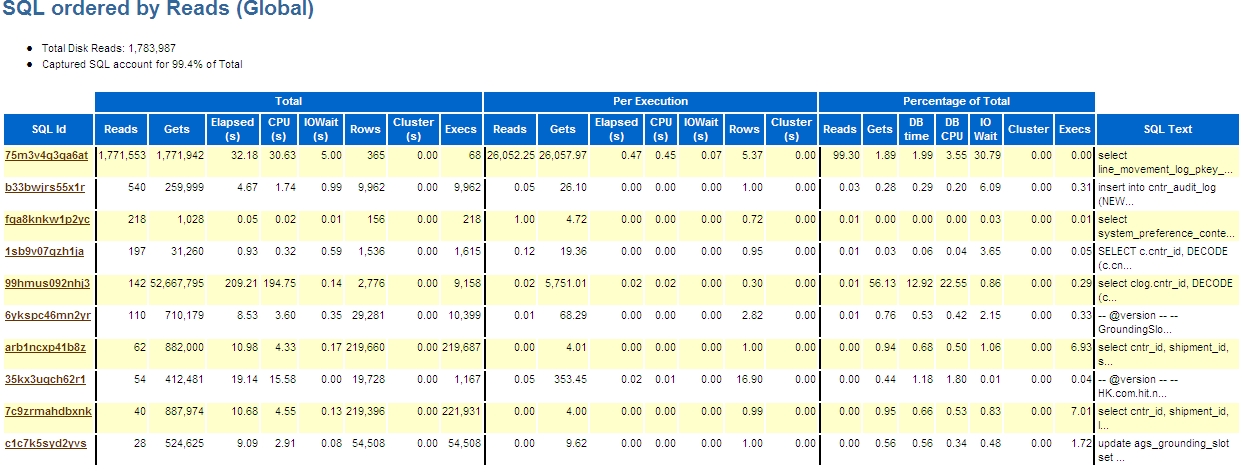 )
)
http://testwo.com/attachment/201010/29/7639_1288333329NjaU.jpg
SQL Statistics(11g)
~~~~~~~~~~~~~~
-> CPU and Elapsed Time are in seconds (s) for Statement Total and in
milliseconds (ms) for Per Execute
% Snap
Statement Total Per Execute Total
--------------- --------------- ------
Buffer Gets: 1,763,651 25,936.0 1.89
Disk Reads: 1,762,900 25,925.0 98.98
Rows processed: 383 5.6
CPU Time(s/ms): 32 466.0
Elapsed Time(s/ms): 34 498.8
Sorts: 68 1.0
Parse Calls: 9 .1
Invalidations: 0
Version count: 1
Sharable Mem(K): 92
Executions: 68
SQL Statistics(10g)
~~~~~~~~~~~~~~
-> CPU and Elapsed Time are in seconds (s) for Statement Total and in
milliseconds (ms) for Per Execute
% Snap
Statement Total Per Execute Total
--------------- --------------- ------
Buffer Gets: 1,765,139 25,957.9 1.66
Disk Reads: 0 0.0 .00
Rows processed: 405 6.0
CPU Time(s/ms): 44 645.2
Elapsed Time(s/ms): 45 666.1
Sorts: 68 1.0
Parse Calls: 11 .2
Invalidations: 0
Version count: 1
Sharable Mem(K): 92
Executions: 68
Solution:
Parameters : _small_table_threshold
Default val : 2% of db_cache_size (about the size of
93MB as current size for pdhptlt11g is 1008MB)
Param Usage: When Oracle finds
the underlining data segment size is larger than the setting of this parameters,
it will always perform disk read rather than searching buffer cache WHENEVER
there is a FULL table scan operation suggested by optimizer..
# Reduce physical read of LINE_MOVEMENT_LOG
# formula 14% of buffer cache:
# 1GB buffer cache means 140MB, 140MB means 35000 blocks (4k blocksize)
_small_table_threshold=35000