方法一:autotrace
1, connect sys/密码 as sysdba,在sys用户下运行$ORACLE_HOME/sqlplus/admin/plustrce.sql
这段sql的实际内容如下:
set echo on
drop role plustrace;
create role plustrace;
grant select on v_$sesstat to plustrace;
grant select on v_$statname to plustrace;
grant select on v_$mystat to plustrace;
grant plustrace to dba with admin option;
set echo off
以上产生plustrace角色,然后在sys用户下把此角色赋予一般用户
SQL> grant PLUSTRACE to 用户名;
2,然后在当前用户SQL>下运行$ORACLE_HOME/rdbms/admin/utlxplan.sql,它会创建一个plan_table,用来存储分析SQL语句的结果。
实际执行的是如下语句:
create table PLAN_TABLE (
statement_id varchar2(30),
timestamp date,
remarks varchar2(80),
operation varchar2(30),
options varchar2(30),
object_node varchar2(128),
object_owner varchar2(30),
object_name varchar2(30),
object_instance numeric,
object_type varchar2(30),
optimizer varchar2(255),
search_columns number,
id numeric,
parent_id numeric,
position numeric,
cost numeric,
cardinality numeric,
bytes numeric,
other_tag varchar2(255),
partition_start varchar2(255),
partition_stop varchar2(255),
partition_id numeric,
other long,
distribution varchar2(30));
3,SQL/PLUS的窗口运行以下命令
set time on; -- (说明:打开时间显示)(可选)
set autotrace on; -- (说明:打开自动分析统计,并显示SQL语句的运行结果)
set autotrace traceonly; -- (说明:打开自动分析统计,不显示SQL语句的运行结果)
4,接下来你就运行需要查看执行计划的SQL语句,看到其分析统计结果了。一般来讲,我们的SQL语句应该避免对大表的全表扫描。
5,关闭以上功能,在SQL/PLUS的窗口运行以下命令
set time off; --(说明:关闭时间显示)
set autotrace off;
附:相关的set autotrace命令:
SET AUTOTRACE OFF
No AUTOTRACE report is generated.
SET AUTOTRACE ON EXPLAIN
shows only the optimizer execution path.
SET AUTOTRACE ON
STATISTICS shows only the SQL statement execution statistics.
SET AUTOTRACE ON
includes both the optimizer execution path and the SQL statement execution statistics.
SET AUTOTRACE TRACEONLY
Like SET AUTOTRACE ON, but suppresses the printing of the user’s query output, if any.
说明:如果执行了set autotrace on 语句,接下来的查询、插入、更新、删除语句就会显示执行计划和有用的统计信息,直到执行set autotrace off语句。
方法二: EXPLAIN PLAN FOR sql
1,在sqlplus下执行:EXPLAIN PLAN FOR sql语句,执行后会提示已经解释。
2,然后执行如下查询,查询出执行计划
SQL> select * from table(dbms_xplan.display);
例子:
SQL> explain plan for select * from emp where deptno='20';
Explained.
SQL> select * from table(dbms_xplan.display);
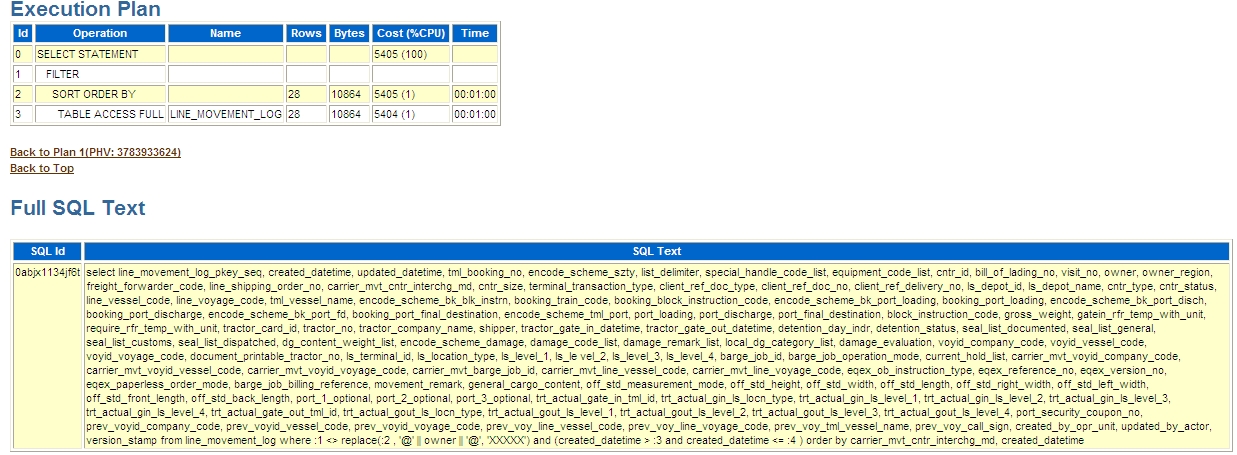
注:除了上面的,还有一个很有用的函数dbms_xplan.display_awr(sql_id
,null,null,'ALL');这个可以结合AWR报告中的SQL语句的SQL_ID来获得历史语句的执行计划,然后通过视图 dba_hist_sqlbind
找到语句对应的绑定变量值。
http://space.itpub.net/9399028/viewspace-678296
http://testwo.com/attachment/201011/25/7639_1290652776297d.jpg
select datatype_string, position,value_string, was_captured
from dba_hist_sqlbind sb
where sql_id ='0abjx1134jf6t' and snap_id ='73'
VALUE_STRING
@V04A@,@V04B@,@V04C@,@V04D@,@V04E@,@V04F@,@V04G@,@V04H@,@V04J@,@V04K@,@V04L@,@V04M@